Growth of Global Solar and Wind Energy Continues to Outpace Other Technologies

Worldwatch Institute
Global use of solar and wind energy continued to grow significantly in 2012. Solar power consumption increased by 58 percent, to 93 terrawatt-hours (TWh), and the use of wind power increased by 18 percent, to 521 TWh.
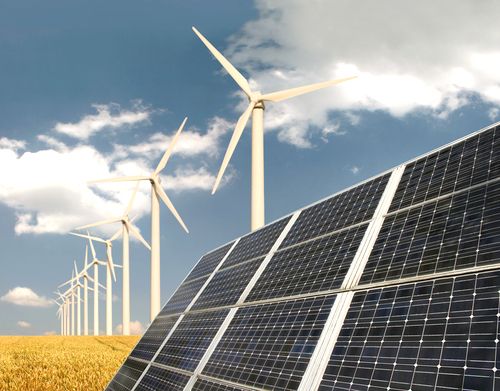
Photo courtesy of Shutterstock
Although hydropower remains the world’s leading renewable energy, solar and wind continue to dominate investment in new renewable capacity and are quickly becoming the highest-profile renewable energy sources, write Worldwatch staff in the Institute’s latest Vital Signs Online trend.
Global solar and wind energy capacities continued to grow even though new investments in these energy sources declined during 2012. Global investment in solar energy in 2012 was $140.4 billion, an 11 percent decline from 2011, and wind investment was down 10 percent, to $80.3 billion. But due to lower costs for both technologies, total installed capacities grew sharply.
Solar photovoltaic (PV) installed capacity grew by 41 percent in 2012, reaching 100 gigawatts (GW). Over the past five years alone, installed PV capacity grew by 900 percent from 10 GW in 2007. The countries with the most installed PV capacity today are Germany (32.4 GW), Italy (16.4 GW), the U.S. (7.2 GW) and China (7.0 GW).
Europe remains dominant in solar, accounting for 76 percent of global solar power use in 2012. Germany alone accounted for 30 percent of the world’s solar power consumption, and Italy added the third most capacity of any country in 2012 (3.4 GW). Spain added the most concentrating solar thermal power capacity (950 MW) in 2012 as well. However, Italy reached the subsidy cap for its feed-in tariff (FIT) program in June 2013 while Spain recently made a retroactive change in its FIT policies, meaning growth in solar energy will likely slow in these countries in the near future.
Due to slowing global economic growth, easing demand and oversupply, there were significant net losses in the Chinese PV industry, which supplies more than half of the world market. The net losses have been exacerbated by growing trade wars between China and both the European Union (EU) and the U.S. after these regions accused Chinese companies of dumping solar panels on their markets. Meanwhile, China’s domestic demand is likely to grow. The country’s twelfth Five-Year Plan aims to reach 21 GW installed solar capacity by 2015 and 50 GW by 2020.
Total installed wind capacity edged up in 2012 by 45 GW to a total of 284 GW, an 18.9 percent increase from 2011. In keeping with recent years, the majority of new installed capacity was concentrated in China and the U.S., which reached total installed capacities of 75.3 GW and 60 GW, respectively.
The U.S. was the world’s top wind market in 2012. Overall capacity increased 28 percent as the country added 13.1 GW, double the amount it added in 2011. Increased domestic manufacturing of wind turbine parts, improved technological efficiency and lower costs helped spur this increase, but the greatest catalyst was the threat of expiration of the federal Production Tax Credit (PTC)—which provides tax credits for kilowatt-hours produced by wind turbines—at the end of 2012.
A slowdown was originally expected in 2013, but the U.S. Congress extended the PTC until the end of the year, which bodes well for many U.S. and European wind turbine and parts manufacturers that benefit from it.
The EU remained a dominant region for wind power, as it passed an important milestone by installing 11.9 GW of new capacity to reach 106 GW, representing 37.5 percent of the world’s market. Currently, wind accounts for 11.4 percent of the EU’s total installed generation capacity. Germany and Spain remained Europe’s largest wind markets, increasing their total installed capacity to 31.3 GW and 22.8 GW, respectively. The United Kingdom was third in new installations in 2012, at 1.9 GW, followed by Italy with 1.3 GW.
“Although policy uncertainties and changes will likely challenge the growth of solar and wind in the future, these technologies are nonetheless well poised to grow,” said Matt Lucky, report co-author and sustainable energy lead researcher at Worldwatch. “Declining solar technology prices, while challenging for current manufacturers, are helping solar to reach near grid-parity in many markets. With the decreasing cost of operating and maintaining wind farms, wind power is already cost competitive with conventional power energy sources in many markets.”
Further highlights from the new Worldwatch Institute report examining the global market for solar and wind energy production include:
- In 2012, installed capacity for concentrating solar thermal power (CSP) reached 2.55 GW, with 970 megawatts (MW) alone added in 2012.
- The Asia-Pacific region now accounts for 17 percent of global solar use, leaving it behind only Europe.
- Asia’s 15.5 GW of new installed wind capacity, the highest of any region in 2012, ensured that it remains on the heels of the EU.
- Political instability continued to slow growth in Africa and the Middle East, but installed capacity grew by 9.3 percent in 2012 compared with 2011’s rate of 2.6 percent.
Visit EcoWatch’s RENEWABLES page for more related news on this topic.
——–

 233k
233k  41k
41k  Subscribe
